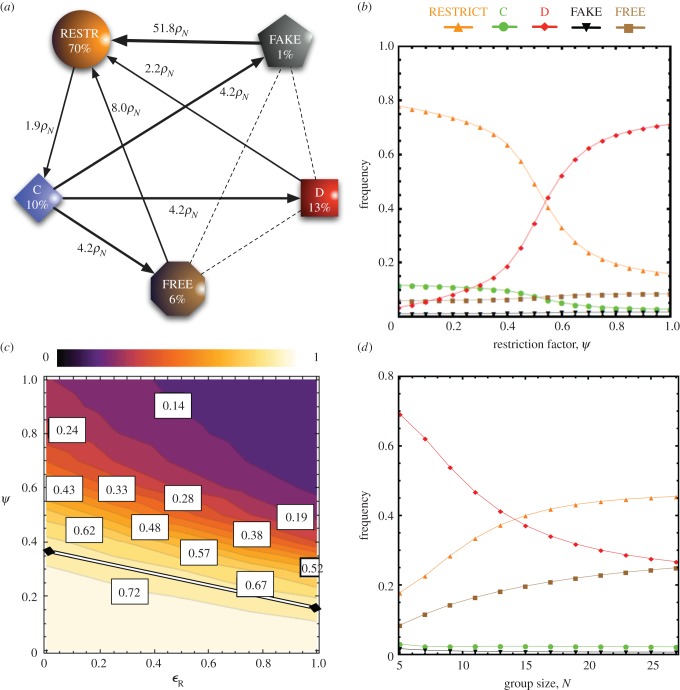
Figure 2.
(a) Transition probabilities and stationary distributions in case of RESTRICT. For an efficient restriction (εR = 0.5 and ψ = 0.25), the population spends most of the time in the homogeneous state of RESTRICT. Notations are the same as in figure 1a. (b) Frequencies of each strategy for varying ψ, in case of RESTRICT. For a given cost of restriction (εR = 0.5), in general the better the effect of restriction on non-committers (i.e. the smaller ψ), the greater the frequency of RESTRICT. (c) Frequency of RESTRICT as a function of εR and ψ, in a population with C, D, FREE and FAKE strategies. For a large range of cost for restricting the access of non-committers, εR, and the restriction, ψ, RESTRICT is highly frequent, having a higher frequency than AVOID. The double-stroke line corresponds to the part having the same frequency as AVOID (i.e. 0.64, with the same parameter values), and the area below this line identifies the area in which RESTRICT is more frequent than AVOID. In general, the larger εR, the smaller ψ is required for RESTRICT to be advantageous to AVOID. (d) Frequencies of each strategy as a function of the group size, N. RESTRICT becomes more frequent when the group size increases, even for a rather high cost of restriction (εR = 2.0). Parameters: in panels (a–c): N = 5; in all cases, Z = 100, r = 3; εP = 0.25, δ = 2; β = 0.1.

