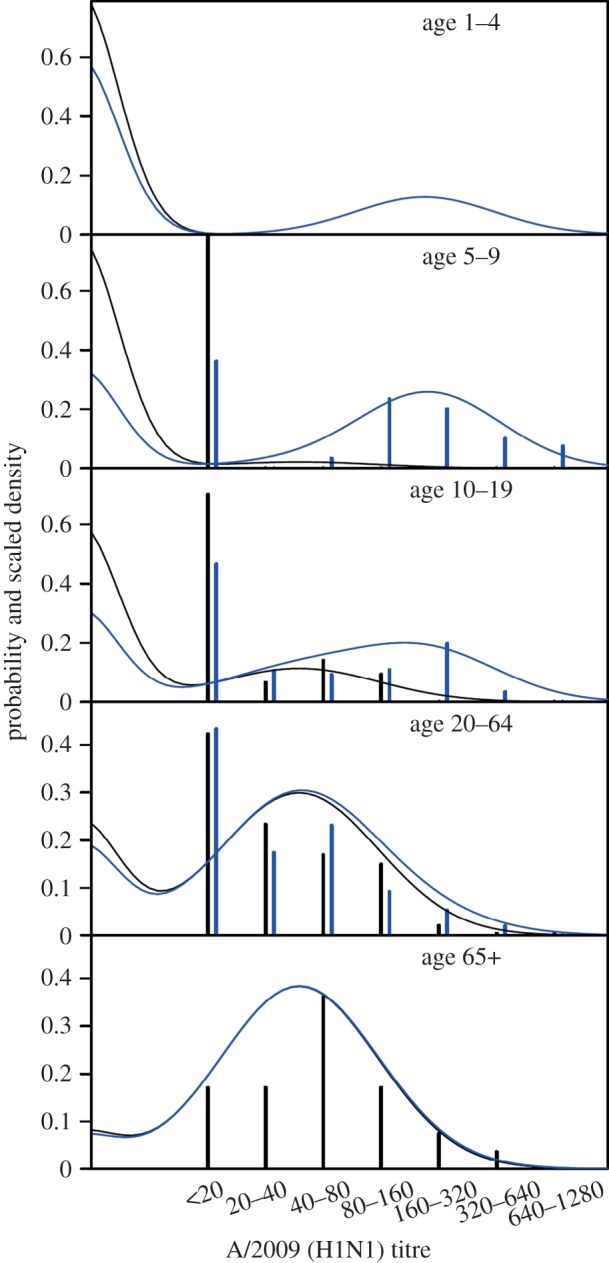
Figure 1.

Overview of the serological data (bars) and fit of the model with school holiday (lines). Panels show results for the various age groups. Bars show the serological data aggregated in titre classes (<20, 20–40, 40–80, 80–160, 160–320 and 320–640). Black bars and black lines denote pre-pandemic data and pre-pandemic model fit, respectively. Blue bars and lines show the post-pandemic data and post-pandemic model fit. Note that no serological data are available in young children (1–4 years) and that only pre-pandemic data are included in the oldest age group (65+ years).
