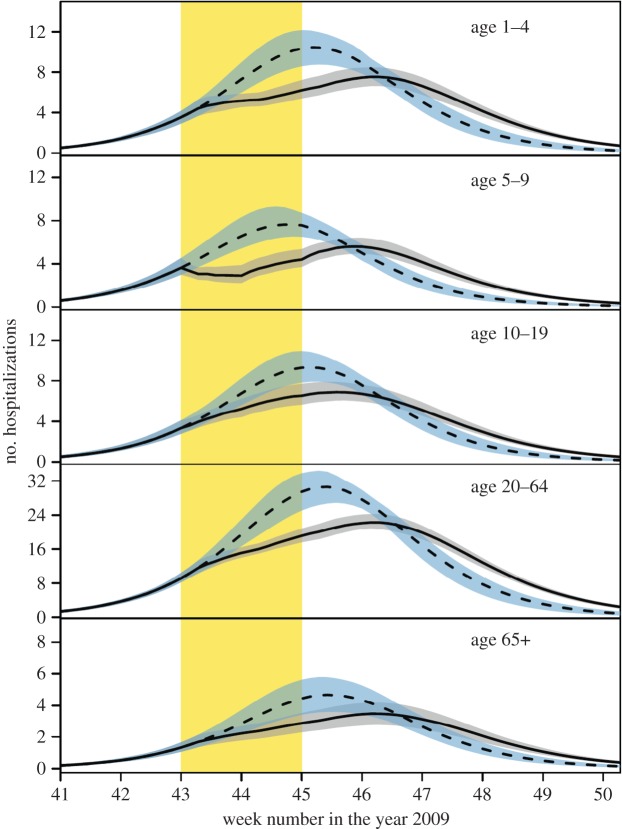
Figure 3.
Comparison of model fit (solid black line) with predicted epidemic dynamics in the absence of the school holiday (dashed black line). The area shaded in yellow indicates the timing of the school holiday, and the grey and blue shaded areas represent 95% credible intervals of the model estimate (black) and predicted dynamics without school holiday (blue). The predicted epidemic dynamics was obtained by simulation of the dynamics without school holiday, but with parameter estimates (samples from the posterior distribution) from the model with school holiday (table 2).

