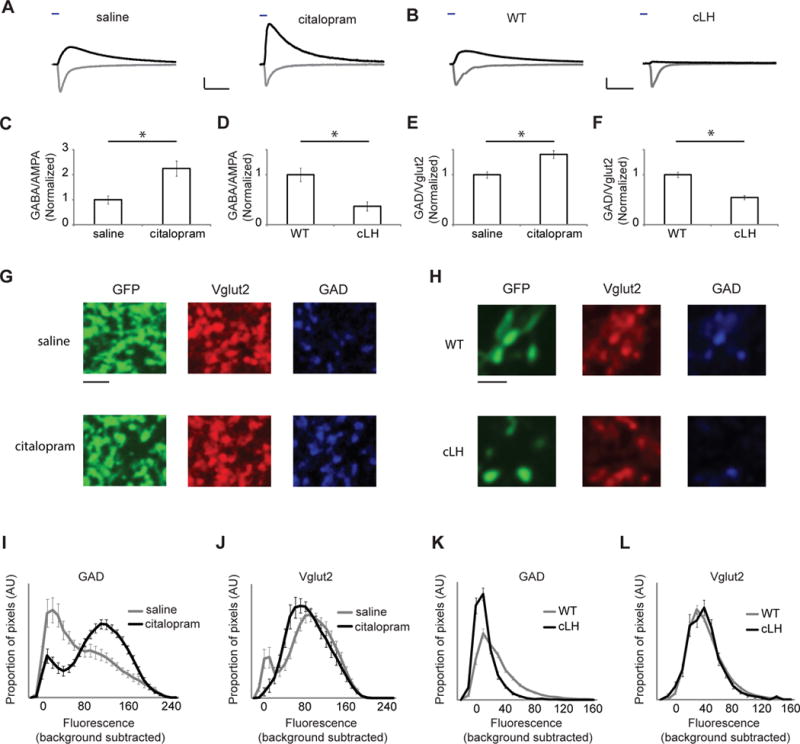
Fig. 4.

Altered co-release of GABA in conditions related to depression. (A) Sample whole-cell recordings of GABA-A-R- (black) and AMPA-R-mediated (gray) light-evoked EP-LHb responses from animals treated with saline or citalopram (10 mg/kg, i.p.). Scale bars: 200 pA, 20 ms. (B) Sample recordings, as in (A) in WT rats and cLH rats. Scale bars: 200 pA, 20 ms. (C) Bar graph of GABA-A-R-mediated/AMPA-R-mediated response at EP-LHb synapses for indicated groups normalized to average of saline ratios (N = 19 cells from 4 saline-treated mice and 24 cells from 4 citalopram-treated mice). (D) Bar graph of responses, as in (C) for WT and cLH rats normalized to average of WT ratios (N = 41 cells from 9 WT rats and 23 cells from 9 cLH rats). (E) Ratio of average background subtracted pixel intensities for GAD and Vglut2 in terminals originating from EP (26) for indicated groups (N = 24 images from 3 saline-treated mice, 21 images from 3 citalopram-treated mice). (F) Ratios, as in (E) for WT and cLH rats (N = 32 images from 7 WT rats, 21 images from 3 cLH rats). (G) Example confocal images from a saline and a citalopram-treated mouse. Scale bar: 3 μm. (H) Example confocal images from a WT rat and a cLH rat. Scale bar: 3 μm. (I) GAD fluorescence in pixels displaying Vglut2 and GFP labels in tissue from animals treated with citalopram or saline (% of Vglut2+, GFP+ pixels showing GAD fluorescence: saline, 54 ± 5%, 21 images; citalopram, 79 ± 2%, 24 images; P < 10−4). (J) Vglut2 fluorescence in pixels displaying GAD and GFP labels in tissue from animals treated with citalopram or saline (% of GAD+, GFP+ pixels showing Vglut2 fluorescence: saline, 80 ± 3%, 21 images; citalopram, 79 ± 3%, 24 images; P = 0.8). (K) GAD fluorescence, as in (I), for images from WT and cLH rats (WT, 50 ± 3%, 32 images; cLH, 19 ± 3%, 21 images; P < 10−7). (L) Vglut2 fluorescence, as in (J), for images from WT and cLH rats (WT, 61 ± 3%, 32 images; cLH, 61 ± 3%, 21 images; P = 0.9). * P < .002.
