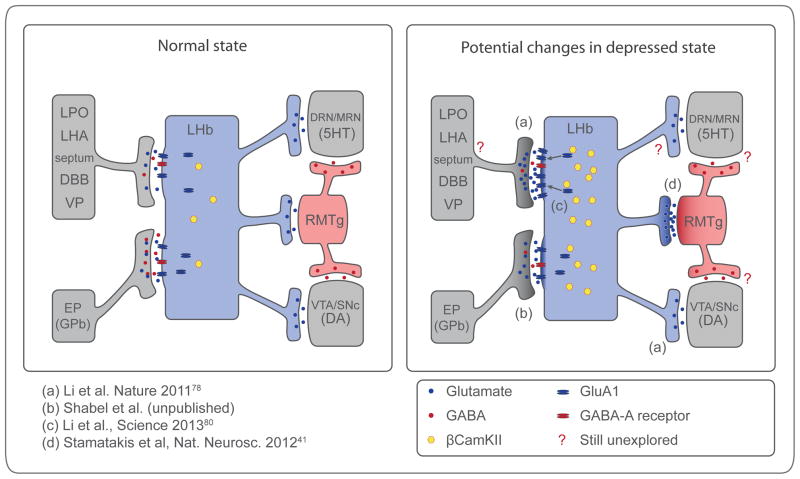
Figure 3.
Potential hyperactive synapses in human depression. Schematic showing main inputs and outputs from the lateral habenula (LHb) in normal state and potential cellular and molecular changes in depressed state. Dark shading represents overactive synapses. Depressed state may include increase in excitatory drive onto the LHb (a, b, c) and increased LHb output to RMTg (d) and VTA (a). See text for details. EP, entopeduncular nucleus; GPb, globus pallidus, border region; LPO, lateral preoptic area; LHA, lateral hypothalamic area; DBB, diagonal band of broca; VP, ventral pallidum; DRN/MRN, dorsal and median raphe nucleus respectively; RMTg, rostromedial tegmental neucleus; VTA, ventral tegmental area; SNc, substantia nigra pars compacta.

