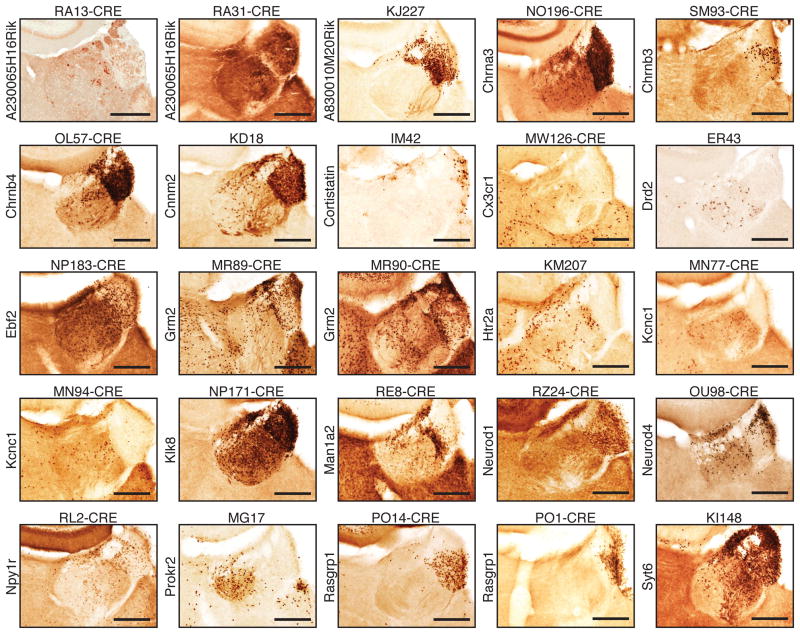
Figure 4.
Transgenic cre-driver mouse lines from GENSAT (gensat.org) that permit targeting of different neuronal ensemble in the LHb and MHb. A representative in situ histochemistry image encompassing the habenula is shown for different founder cre lines (founder line name on top of each image) where cre expression is driven under specified gene promoter (gene name on the left of each images). These lines are available from GENSAT (gensat.org). Scale bars are 250 um.

