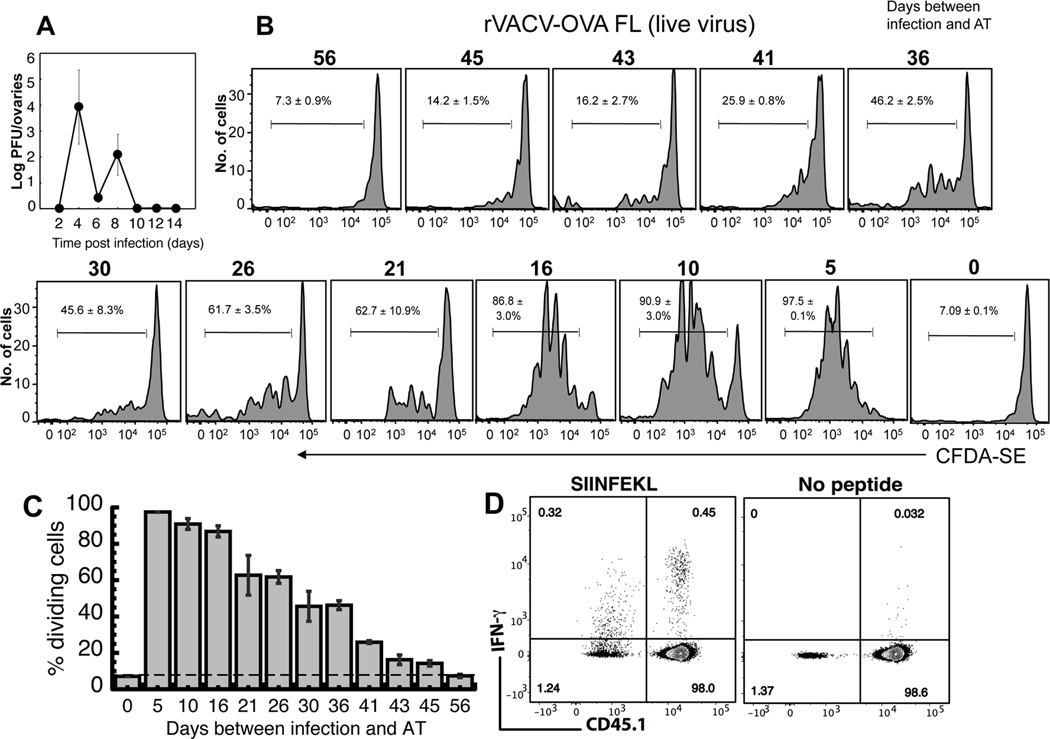
Figure 1. The persistence of virus and antigen presentation following infection with rVACV.
(A) Mice were infected with rVACV and ovaries were removed at times indicated. A plaque assay was used to determine rVACV titer. Error bars represent the standard error. (B) OT-1.SJL TCD8+ cells were labeled with CFDA-SE and transferred i.v. into mice previously infected with rVACV-OVA FL. Three days after transfer, spleens were removed and analyzed for CFDA-SE dilution. Representative histograms display gated CD45.1+ TCD8+ from individual mice of five replicate experiments with similar results. Numbers represent the mean percentage of CD45.1+ TCD8+ that have undergone proliferation. (C) Graphical representation of the percentage of replicating OT-1.SJL TCD8+ cells at each time point after VACV infection. Error bars represent the standard error. (D) OT-1 TCD8+ cells (CD45.2) were transferred i.v. into B6.SJL (CD45.1+) mice infected with rVACV-OVA.FL 21 d previously. On d7 post-transfer, spleens were harvested and cells stimulated ex vivo for 5 hrs with SIINFEKL in the presence of Brefeldin A. IFN-γ production by donor (CD45.1−) and recipient (CD45.1+) TCD8+ cells was assessed by intracellular cytokine staining assay. Flow plots are gated on CD8α+ cells and are representative of 2 independent experiments with 4 mice each.

