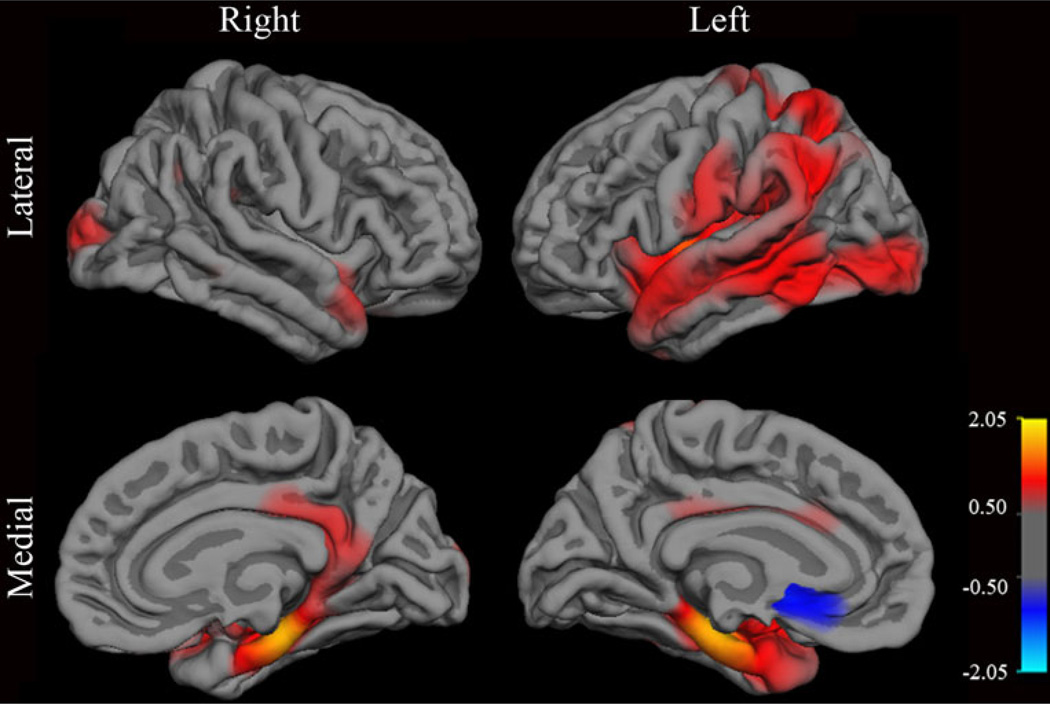
Fig. 1.
Association of baseline cortical thickness at each vertex with the interaction of CETP SNP I405V by APOE ε4 carrier status in all subjects after controlling for the effects of age, gender and diagnosis. The map shows the distribution of nominal −log p-values across the reconstructed cortical surface. The sign represents the direction of the effect. Red values correspond to the I allele associating with greater cortical thickness in APOE ε4 non-carriers and the V allele associating with greater cortical thickness in APOE ε4 carriers. Blue values represent the reverse relationship. The most significant effects of this genotype interaction are seen in the parahippocampal gyrus

