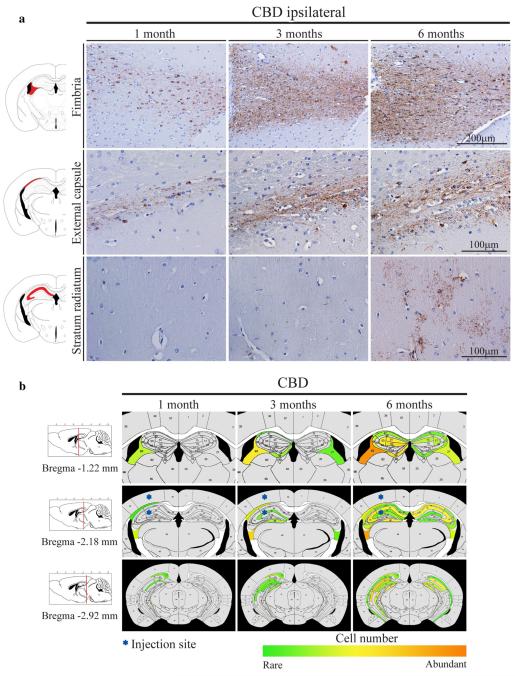
Fig. 3.
Tau inclusions that developed in PS19 mice injected with CBD-Tau increased in intensity and spread to regions distal from the injection site with increasing post-injection survival times. a Microphotographs of brain sections immunostained with AT8 showing the fimbria, alveus/external capsule and stratum radiatum ipsilateral to the injection site in the PS19 mice at 1, 3, 6 months post-injection. Scale bar, upper row 200 μm; middle and lower rows 100 μm. b Heatmaps of coronal sections showing the CBD-Tau-induced glial tau pathology at the same time points as in (a). Quantification [1 month (n = 6), 3 months (n = 6) and 6 months (n = 6)] was conducted as described in “Materials and methods” to generate these heatmaps. Each heatmap panel represents pathology distribution in one of the three coronal planes (Bregma −1.22, −2.18 and −2.92). Left column shows sagittal view of the selected coronal planes indicated by a red line. Blue stars indicate injection site

