
Figure 1. Differences between the BCs and control cohort in the overall costs, observed direct costs, and expected direct costs.
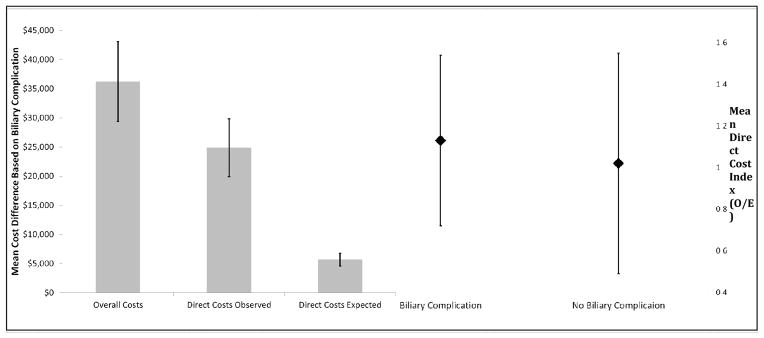
The bar graph to the left represents costs differences, comparing those that developed a biliary complication to those that did not. The higher number represents increased costs that were associated with biliary complications. For example, overall mean cost difference was $225,303 – $189,091. The chart to the right represents the mean direct cost index, calculating using the observed-to-expected cost ratios for those with and without biliary complications. A direct cost index of 1·00 represents an expected direct cost. The direct cost index for patients with biliary complications was 1·13±0·41 vs. 1·02±0·53 for those without such complication (p<0·001).