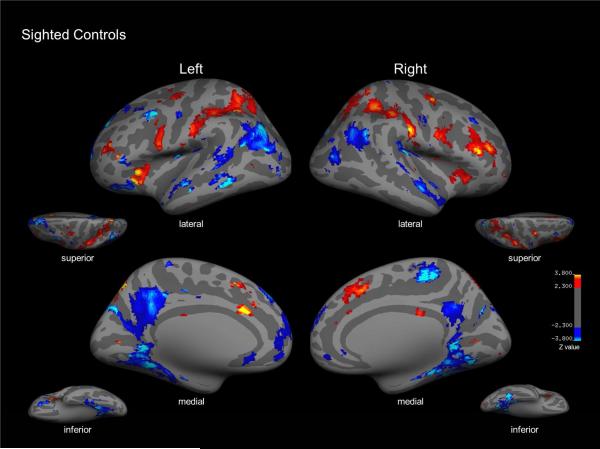
Figure 4.
Sighted control group map for tactile symmetry detection vs. motor control contrast (red). Inflated lateral, medial, superior, and inferior views of left and right hemispheres reveal activation within right superior frontal cortex and bilateral activation within frontal areas, superior parietal cortex as well as the operculum. The contrast of motor control vs. symmetry detection (blue) showed significantly greater bilateral activation in regions including inferior parietal cortex, precuneus and along parahippocampal regions.

