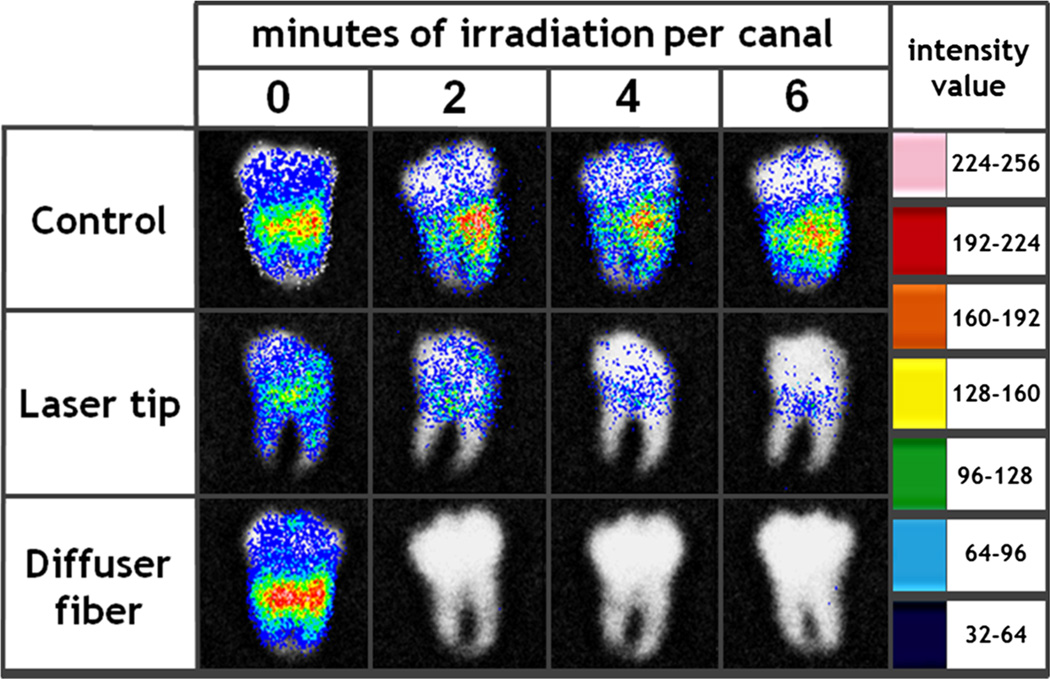
Fig. 4.
Representative bioluminescence images from control, laser tip, and diffuser fiber groups. It can be observed that after 2 min of irradiation per canal employing the diffuser fiber, only weak or null bioluminescence signals are detected, while the laser tip group is still considerably contaminated even after having been exposed to three times higher energies. Argus software transformed the grayscale photon count 8-bit image (0 for detection threshold and 256 for saturation) into false colors according to the light intensity between minimum blue and maximum pink values

