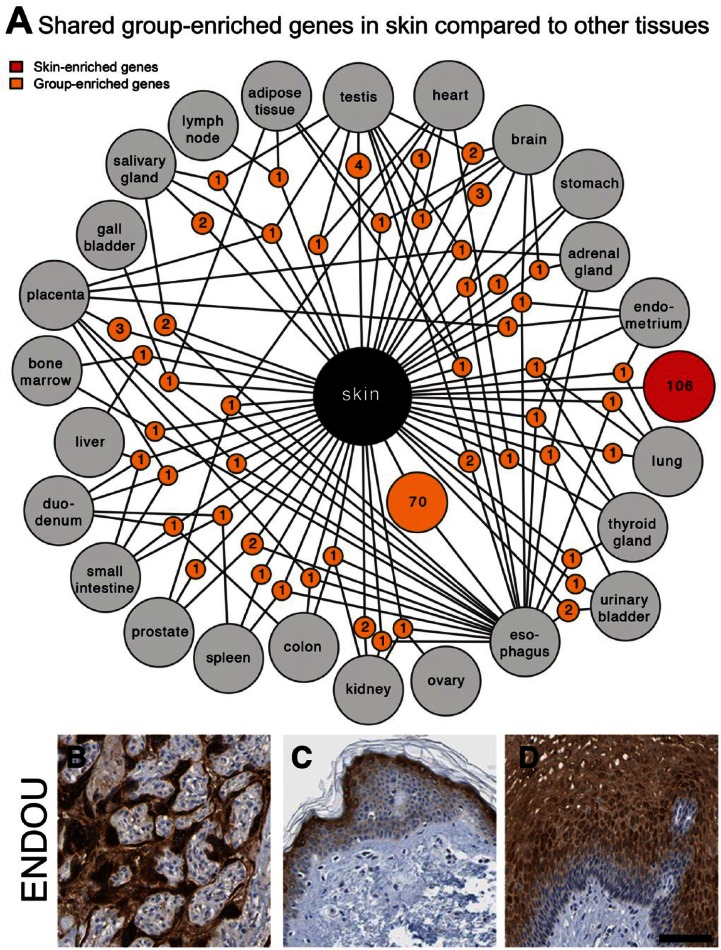
Figure 2.
Group enriched genes in skin. (A) Network plot of skin enriched (red circle) and group enriched (yellow circles) genes showing the relationship between the analyzed tissues. Yellow circle nodes represent group enriched genes in skin and are connected to the respective enriched tissues (grey circles). Only genes group enriched in combinations of up to four tissues are shown. Most tissues share 1-4 group enriched-genes with skin, but esophagus stands out by sharing 70 group enriched genes (Table S4). Many of these correspond to genes known to be important for squamous epithelial biology but a number of genes have less defined function in squamous epithelia as exemplified by the “placenta-specific” Endou protein expressed in placenta (B), skin (C) and esophagus (D). Scale, 100 µm.

