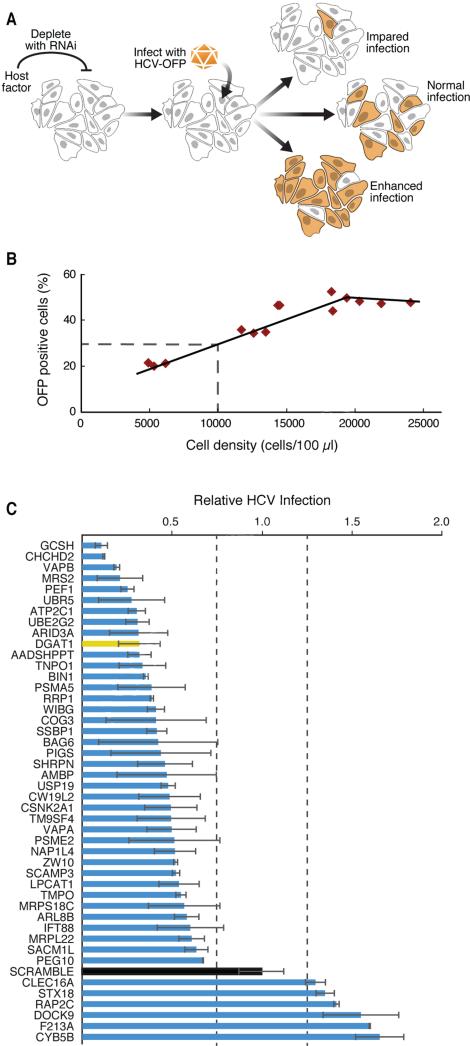
Figure 2. A lentiviral shRNA screen identifies new HCV cofactors.
(A) Schematic of the HCV infection assay with an HCV-OFP (orange fluorescent protein mKO2) reporter virus.
(B) For each infection, we generated a standard curve of expected infection rates in scrambled shRNA-treated cells by plating the cells at indicated densities and obtaining the percentage of OFP-positive cells.
(C) Results of the HCV infection screen. Interacting host proteins that caused changes in infection levels are indicated on the y-axis. Relative infection levels (normalized to cell density) are indicated on the x-axis. The positive control, DGAT1, is shown in yellow, and the negative control, scrambled, in black. Results are shown as average (±SD) of a minimum of six experiments with two independent shRNAs (Experimental Procedures, S5). See also Figure S2 and Table S4.

