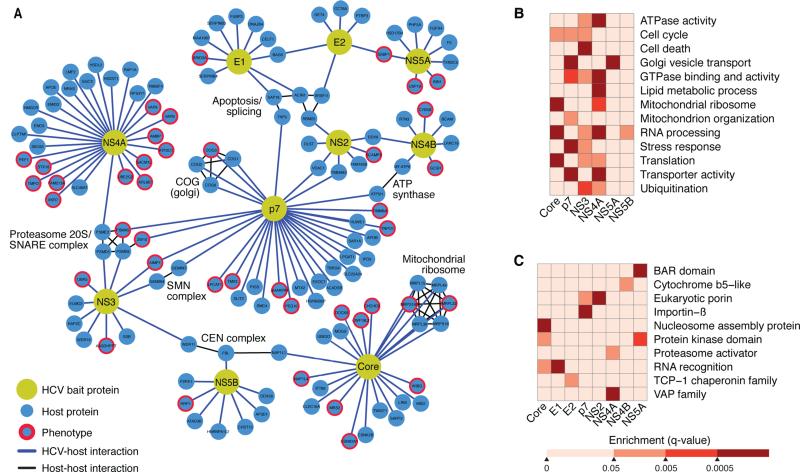
Figure 3. A complete HCV-host protein-protein interaction network in hepatoma cells.
(A) Network representation of the HCV-host interactome in Huh7 cells generated with Cytoscape. There are 10 HCV bait proteins (yellow nodes) and 134 interacting host proteins (blue nodes). Interactions of HCV and host proteins are indicated by blue lines. Curated host-host protein interactions from the CORUM database are indicated by black lines.
(B–C) Heat maps representing manually curated enriched biological processes, molecular functions, and pathways (B) and protein domains (C) of the host factors that interact with HCV bait proteins. Colors represent statistical significance (q value) as indicated by the accompanying scale. See also Table S6.

