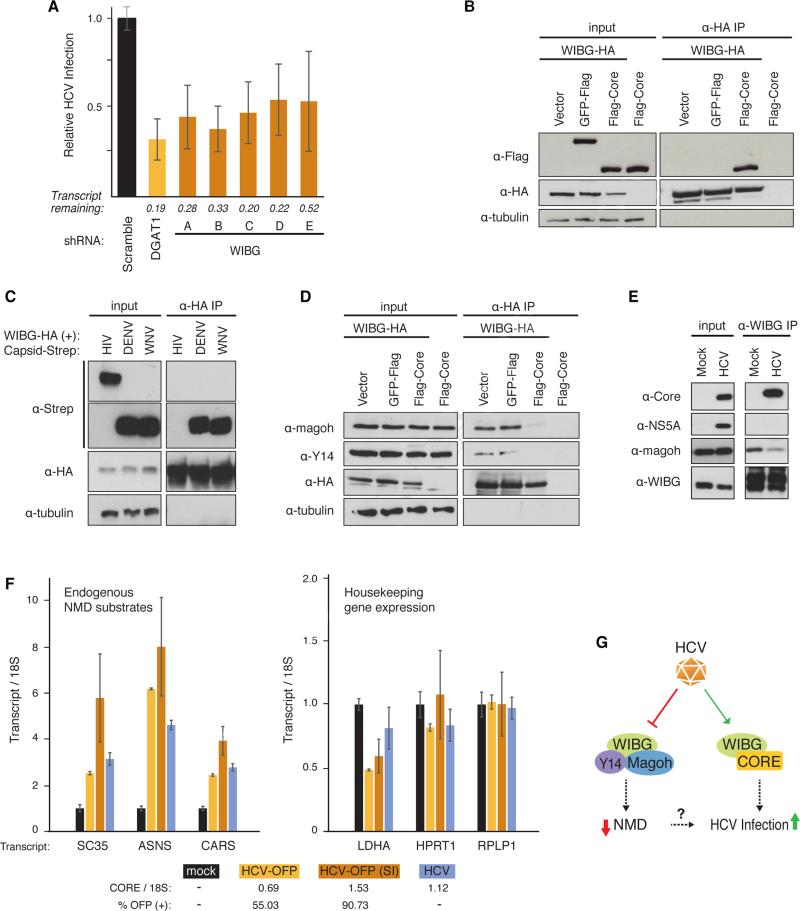
Figure 6. HCV infection requires WIBG and disrupts the host nonsense-mediated decay surveillance pathway.
(A) Relative infection rates (Figure 2A, B) after knock-down of WIBG with five shRNAs or shRNA targeting DGAT1 or scrambled shRNA as positive and negative controls, respectively. Shown is the average (±SD) of at least 12 replicates in two independent experiments.
(B) and (D) Immunoprecipitations in HEK293T cells expressing the indicated constructs along with the flag-tagged HCV core from genotype 2a. Results are representative of three independent experiments.
(C) Immunoprecipitations in HEK293T cells expressing WIBG-HA along with the indicated viral capsids from dengue virus, West Nile virus or HIV-1. Results are representative of three independent experiments.
(E) Immunoprecipitations of endogenous WIBG in mock- and HCV-OFP SI-infected Huh7.5 cells. Results are representative of two independent experiments.
(F) Huh7.5 cells were infected with the indicated HCV constructs. Three endogenous NMD substrate transcripts y (left) and transcripts of three housekeeping genes (right) were analyzed by quantitative RT-PCR. Shown is a representative of three independent experiments. Infection rates based on OFP expression or on quantitative RT-PCR are indicated below.
(G) Model of the WIBG-HCV interaction. See text for details. See also Figure S6.

