
Figure 2.
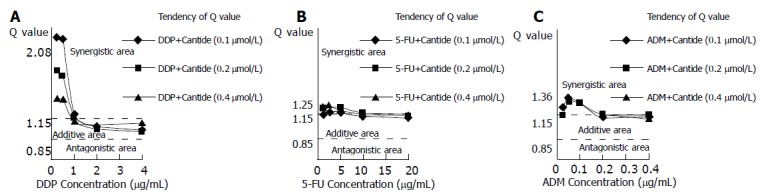
Q values for the combination treatments of Cantide with DDP (A), 5-FU (B) and ADM (C) tested on HepG2 cells. Q values were calculated from the dose-response curves shown in Figure 1 and analyzed with Zheng-Jun Jin method.
Official websites use .gov
A
.gov website belongs to an official
government organization in the United States.
Secure .gov websites use HTTPS
A lock (
) or https:// means you've safely
connected to the .gov website. Share sensitive
information only on official, secure websites.
Q values for the combination treatments of Cantide with DDP (A), 5-FU (B) and ADM (C) tested on HepG2 cells. Q values were calculated from the dose-response curves shown in Figure 1 and analyzed with Zheng-Jun Jin method.