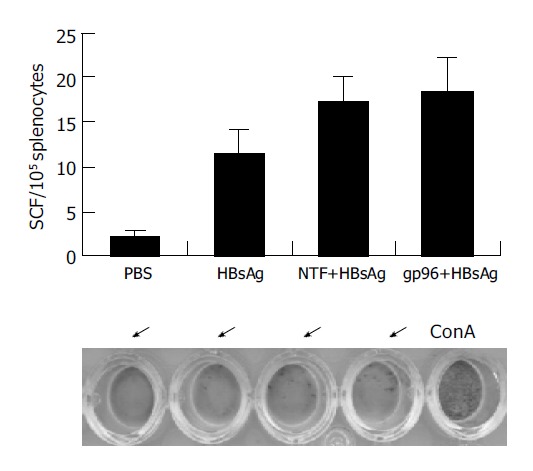
Figure 4.

T-cell response of splenocytes of immunized Balb/c mice. Mice immunized with PBS, HBsAg plus heated NTF, HBsAg plus NTF or gp96 (the same groups as groups 5, 6, and 8 respectively in Figure 3) were killed on d 63 and the splenocytes were collected for ELISPOT assay with 105 cells per well. The number of SFCs was calculated. The photograph of the representative wells from different groups is shown below the statistics.
