
Figure 3.
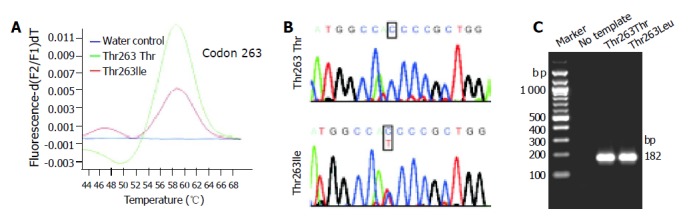
LC analysis of the Thr263Ile polymorphism. A: The derivative melting curves of a representative LC analysis for different samples are plotted. Genotypes identified are: Thr263Thr (green line) and Thr263Ile (red line). The different allelic variants of codon 263 show typical melting temperatures at Tm = 47 °C (Ile263) and Tm = 59 °C (Thr263), respectively. A no-template control is shown in blue; B: Sequencing was performed to confirm the determined genotypes; C: Representative LC products were separated in 8 g/L agarose gels to demonstrate the correct size of synthesized amplicons (182 bp). The sizes of selected molecular weight markers are indicated at the left margin.