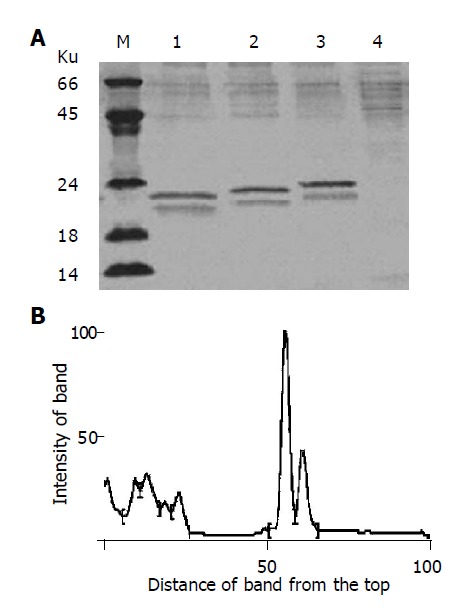
Figure 3.

Expression of the fusion proteins IFNα2b-(G4S)n-Tα1 (n = 1-3) in P. pastoris. A: SDS-PAGE analysis of the fusion proteins. SDS-PAGE was performed on a 150 g/L polyacrylamide gel and stained with Coomassie blue R-250. Lane M: molecular weight marker; lane 1: IFNα2b-G4S-Tα1; lane 2: IFNα2b-(G4S)2-Tα1; lane3: IFNα2b-(G4S)3-Tα1; lane 4, SMD1168/pPIC9 as control; B: Density quantification analysis of lane 2 in A. Peak 4 represents the IFNα2b-(G4S)2-Tα1 fusion protein. Peak 5 represents the degradation fragment.
