
Figure 7.
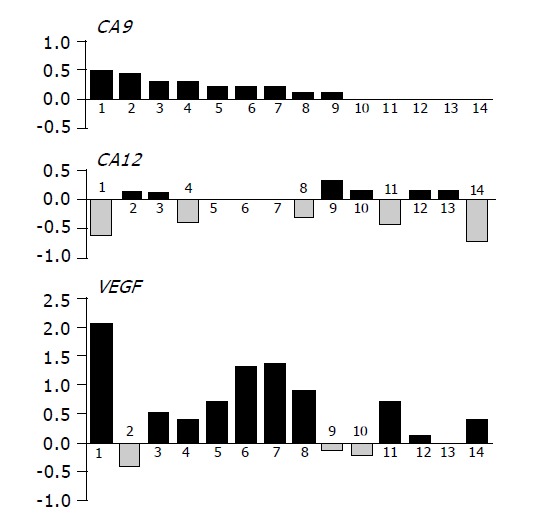
Graphical illustration of the tumor-associated differences in mRNA levels of CA9, CA12 and VEGF in individual patients analyzed by RT-PCR. Values representing relative amounts of mRNAs expressed in normal tissues were subtracted from those obtained in paired pathological lesions. Resulting data were drawn in histograms on compatible scales allowing for their comparisons. Highly significant inverse relationship was found between CA12 and VEGF by χ2 analysis (P = 0.0063).