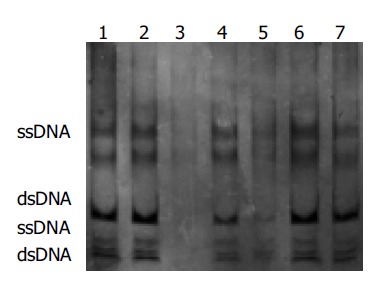
Figure 3.

Exon 2 of p16 gene analyzed by SSCP, Lanes 2, 3, 5, 6, 7: GC; Lane 4: cancer adjacent tissue; Lane 1: normal gastric mucosa. No electrophoresis band in lane 3; weak electrophoresis band in lane 5; no abnormal electrophoresis band in all lanes.
