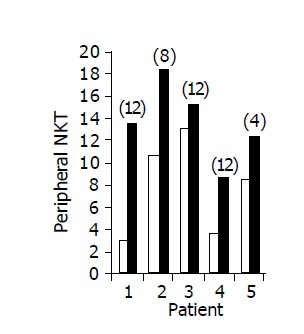
Figure 4.

Peripheral NKT lymphocyte percent in 5/10 patients in whom a significant increase was observed during treatment. Baseline ratio (open bars) as compared to level of maximal increase (black bars, no. of week shown in parenthesis above each bar).
