
Figure 1.
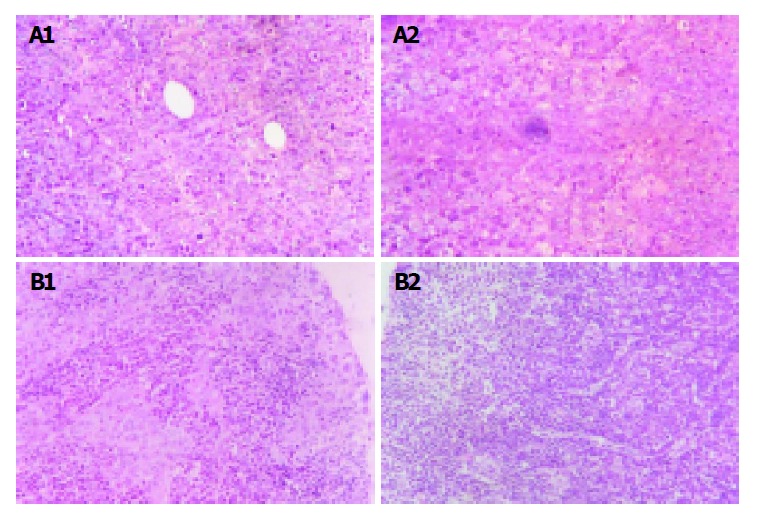
Lymph node metastatic rates of Hca-F and Hca-P. A: Implanted tumor of Hca-F cells and Hca-P cells. H.E. ×400. (1) Implanted tumor of Hca-F cells. (2) Implanted tumor of Hca-P cells; B: Regional lymph node of implanted tumor of Hca-F cells and Hca-P cells. H.E. ×400. (1) Regional lymph node of implanted tumor of Hca-F cells. (2) Regional lymph node of implanted tumor of Hca-P cells.