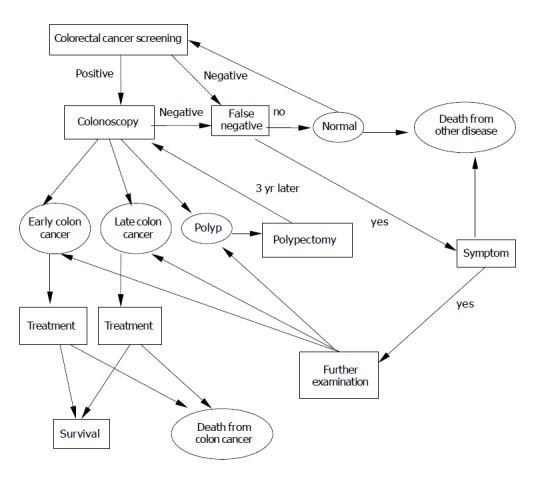
Figure 1.

Markov model of colorectal cancer screening. The ovals represent Markov states in which patients remain for at least full 1-year cycle. The squares represent intermediate states of screening procedures, in which patients may enter and leave during one cycle. The arrows represent transitions between various states.
