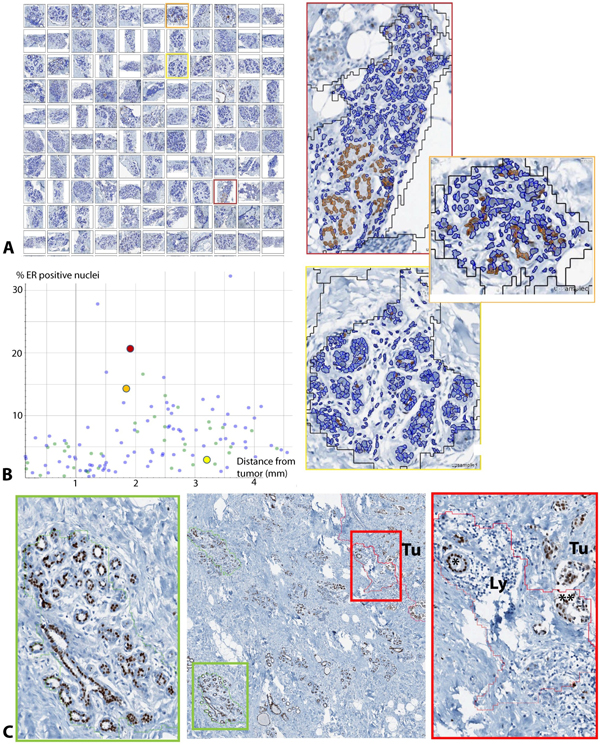
Figure 6.

Quality control by linking data points with regions of interest. Directly linking data points with regions of interest facilitated the evaluation of outliers, exclusion of technical errors, and quality control of the nuclei detection at high resolution. Snapshots of all analyzed lobules in one case labeled in A ("Image gallery") with a colored frame, were tracked in the data plot B, and enlarged for quality control. Note that each individual positive nucleus can be investigated as single image object in their spatial context, for example with regard to clusters of positive cells (orange frame) as compared to diffuse distribution (yellow frame). C Example for an ER positive case with an accurately detected lobule (green frame) and a false positive (red frame), the latter revealing some conceptual challenges in this tumor subtype, such as the distinction between pre-existing, reactively altered tubular structures (*) and ER positive tumor cells with glandular differentiation (**)
