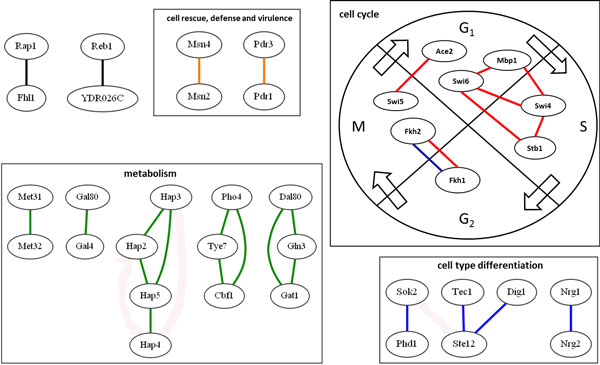
Figure 7.

A TF cooperativity network. A TF cooperativity network is constructed from our 27 predicted cooperative TF pairs. Nodes represent TFs. A black line between two TFs means that these two TFs are predicted to be a cooperative TF pair but they are not annotated in the same MIPS functional category. A colored line between two TFs means that these two TFs are predicted to be a cooperative TF pair and they are annotated in the same MIPS functional category. The green color stands for metabolism, red for cell cycle, blue for cell type differentiation, orange for cell rescue, defense and virulence.
