
Figure 2.
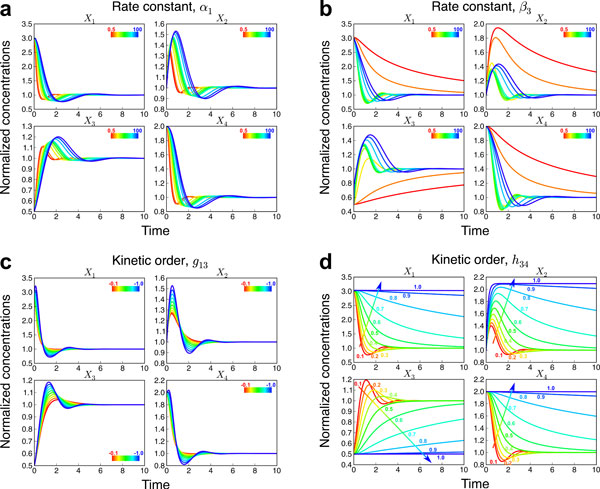
Normalized concentrations of each metabolite in response to variations of rate constants and kinetic orders. a Rate constant α1 was varied at 0.5, 1, 5, 10, 15, 20, 25, 50, 75 and 100 in rainbow- colored lines varying from red to blue, respectively. b Rate constant β3 was varied at 0.5, 1, 5, 10, 15, 20, 25, 50, 75 and 100 in rainbow- colored lines varying from red to blue, respectively. c Kinetic order g13 was varied at 0.5, 1, 5, 10, 15, 20, 25, 50, 75 and 100 in rainbow- colored lines varying from red to blue, respectively. d Kinetic order h34was varied at 0.5, 1, 5, 10, 15, 20, 25, 50, 75 and 100 in rainbow- colored lines varying from red to blue, respectively.