
Figure 3.
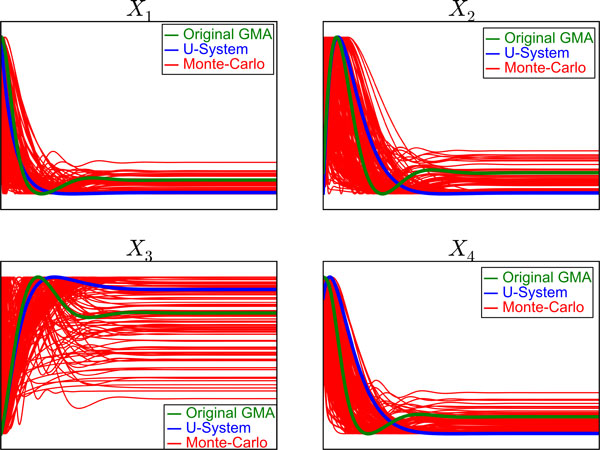
Comparisons among Monte-Carlo simulations, U-system simulations and original GMA model simulations. The U-system simulations and original GMA model simulations are shown in blue and green lines, respectively. The Monte-Carlo simulations in response to changes of rate constants within ranges of 0.5 and 20 and kinetic orders between 0.2(-0.2) and 0.8(-0.8) are shown in red lines. The concentrations of Xi along the y-axis are scaled using maximum and minimum values of each simulation, while the time along the x-axis is scaled using maximal values of the Xi concentrations before they return to their steady-states.