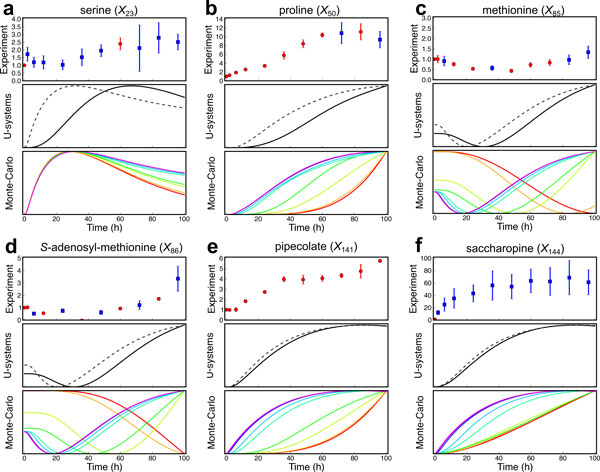
Figure 5.

Comparisons of metabolome data with U-system and Monte-Carlo simulations. Experimental data from metabolome analysis with coefficient of variations less than and more than 20% are represented in red and blue dots, respectively (upper boxes). The U-system and modified U-system simulations for metabolic system of Arabidopsis are represented in gray dotted and black lines, respectively (middle boxes), whereas Monte-Carlo simulations with changes of rate constants between branch points around proline biosynthesis, lysine degradation, methionine salvage pathway, aliphatic GSL biosynthesis (yellow zone in Figure 5), in which parameters are 0.005, 0.01, 0.05, 0.1, 0.5, 1, 5, 10, and 50, are represented in rainbow-colored lines varying from red (0.005) to blue (50), respectively (lower boxes). a, serine (X23); b, proline (X50); c, methionine (X85); d, S-adenosyl-methionine (X86); e, pipecolate, (X141); f, saccharopine (X144). The results for other metabolites are shown in Supplementary Figures (additional file 3).
