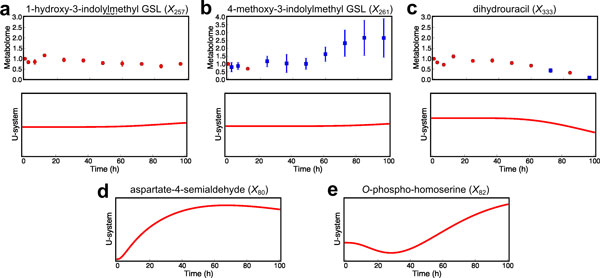
Figure 7.

Predictive simulations from modified U-system approach compared with relative concentrations obtained by metabolome analysis. The red and blue dots represent relative concentrations (see Materials and Methods) of lysine and threonine supplementation experiment with coefficient of variations less than or more than 20%, respectively. Red lines represent simulations from the modified U-system approach. a Simulation compared with relative concentration of 1-hydroxy-3-indolylmethyl GSL (X257). b Simulation compared with relative concentration of 4-methoxy-3-indolylmethyl GSL (X261). c Simulation compared with relative concentration of dihydrouracil (X333). d Simulation for aspartate-4-semialdehyde (X80). e Simulation for O-phospho-homoserine (X82).
