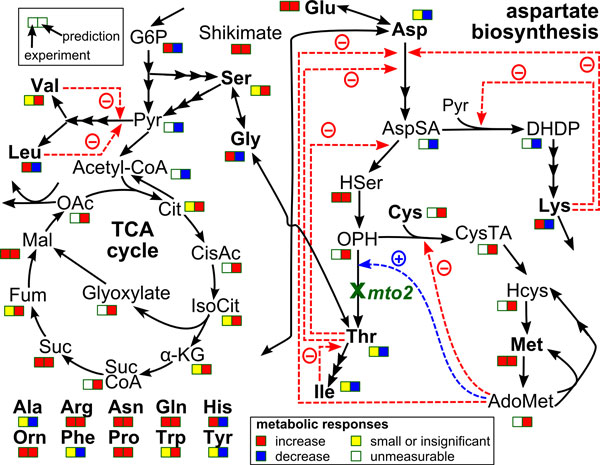
Figure 8.

Qualitative predictions of consequences of gene knockdown. The simplified aspartate-family biosynthesis pathway enlarged from Figure 4. Metabolites (AdoMet, S-adenosyl-methionine; Ala, alanine; Arg, arginine; Asn, asparagine; Asp, aspartate; AspSA, aspartate-semialdehyde; Cit, citrate; CisAc, cis-aconitate; Cys, cysteine; CysTA, cystathionine; DHDP, dihydrodipicolinate; Fum, fumalate; Gln, glutamine; Glu, glutamate; Gly, glycine; G6P, glucose-6-phosphate; Hcys, homocysteine; HSer, homoserine; His, histidine; Ile, iso-leucine; IsoCit, iso-citrate; α-KG, α-ketoglutarate; Leu, leucine; Lys, lysine; Mal, malate; Met, methionine; OAc, oxaloacetate; OPH, O-phosphohomoserine; Orn, ornitine; Phe, phenylalanine; Pro, proline; Pyr, pyruvate; Ser, serine; Suc, succinate; SucCoA, succinyl CoA; Thr, threonine; Trp, tryptophan; Tyr, tyrosine; Val, valine) are represented in black letters whereas the knocked-down gene (mto2, MTO2 encoding threonine synthase) is represented in green letters. Two squares boxes indicate the comparisons between experimental results (the former) and in silico prediction (the latter).
