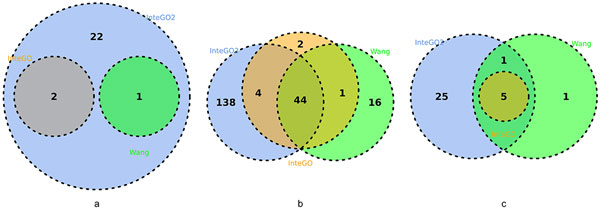
Figure 5.

Venn Diagram for InteGO2, InteGO and Wang in Molecular Function category on human (a), Arabidopsis (b) and yeast (c). Venn Diagram for InteGO2, InteGO and Wang measure with number of ECs on which perform best on human (a), Arabidopsis (b) and yeast (c).
