Figure 6.

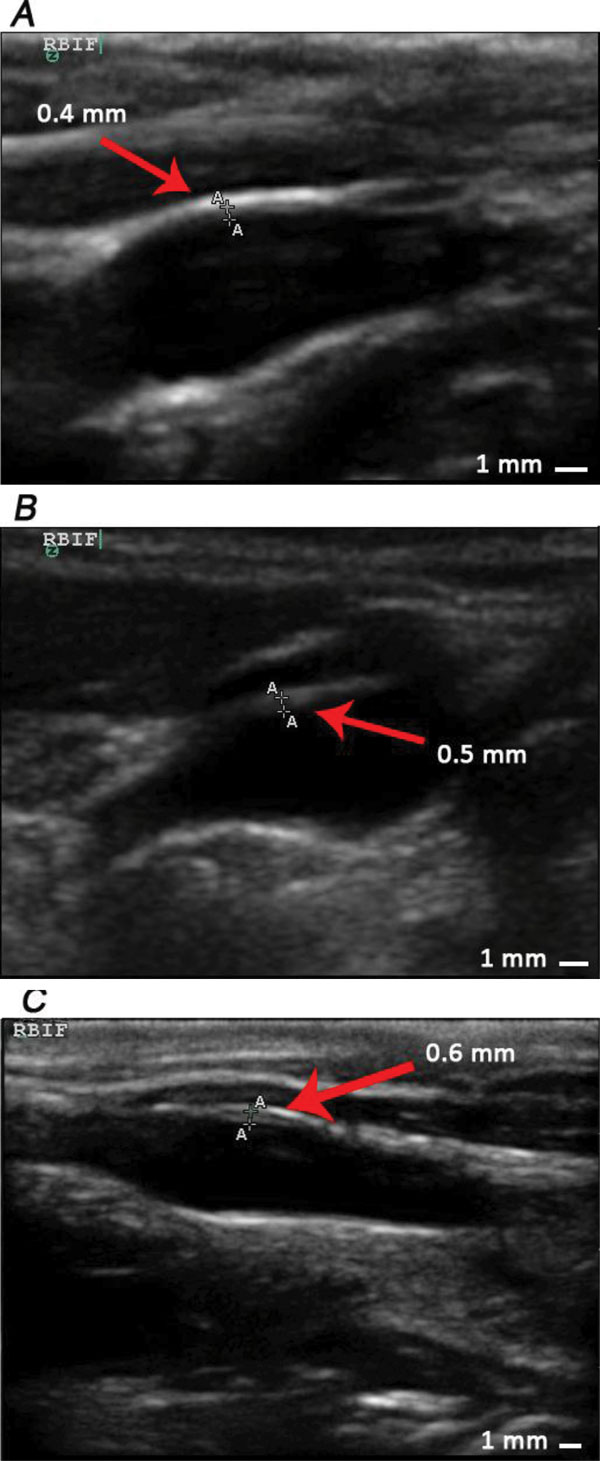
Progress of IMT thickening at AO of one monkey with the No. 4353#. A, B and C represent results measured at the end of phase 1,2,3 respectively, and the values of IMT in picture A, B and C are 0.5 mm, 0.6 mm and 0.8 mm respectively.

Progress of IMT thickening at AO of one monkey with the No. 4353#. A, B and C represent results measured at the end of phase 1,2,3 respectively, and the values of IMT in picture A, B and C are 0.5 mm, 0.6 mm and 0.8 mm respectively.