Figure 4.

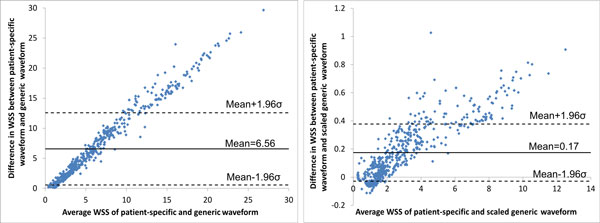
Bland-Altman plots of differences in WSS between patient-specific waveforms and generic waveforms in patient 2 - patient-specific and generic (left), patient-specific and scaled generic (right). The standard deviation is denoted by σ.

Bland-Altman plots of differences in WSS between patient-specific waveforms and generic waveforms in patient 2 - patient-specific and generic (left), patient-specific and scaled generic (right). The standard deviation is denoted by σ.