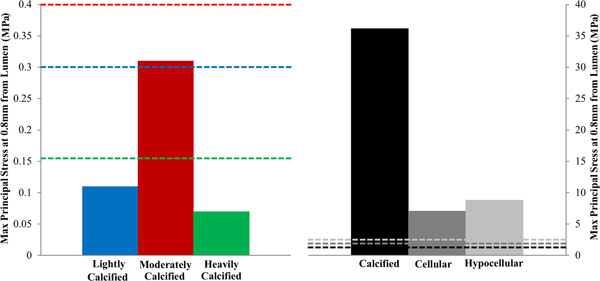
Figure 5.

Maximum principal stress values present in the plaque model at a distance of 0.8 mm from the lumen along the line of interest for each of the material models employed in this study. The dashed lines represent the ultimate failure stress of each material modelled. The blue, red and green dashed lines correspond to the lightly, moderately and heavily calcified femoral groups respectively. Similarly, the black, dark grey and light grey dashed lines correspond to the calcified, cellular and hypocellular aortic groups respectively.
