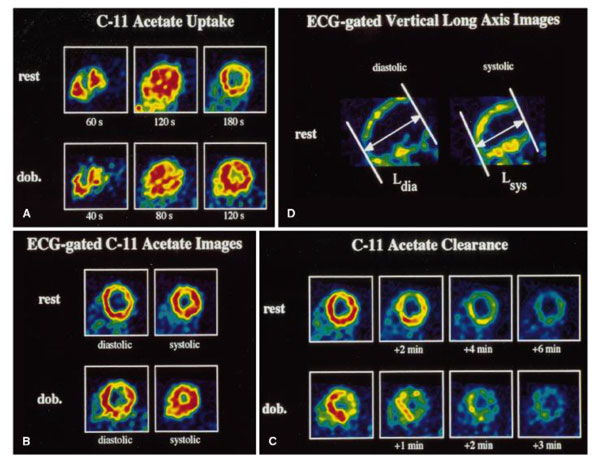
Figure 3.

PET sequence in a midventricular short axis at rest and dobutamine stress. A) images with 11C acetate uptake to estimate myocardial perfusion, B) ECG-gated images to estimate myocardial oxygen consumption. C) The elapsed time after tracer injection was shown under each image. D) The vertical long axis images at both the systolic and diastolic phases [47].
