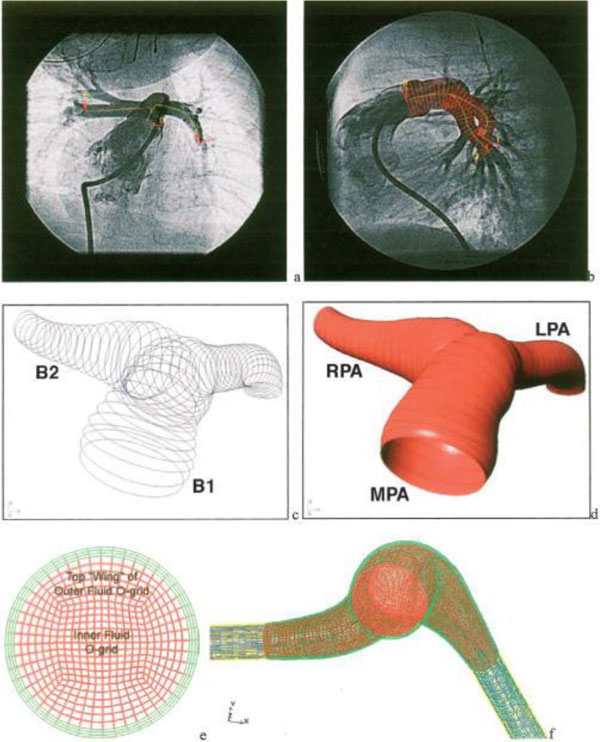
Figure 5.

Patient-specific 3D geometry reconstruction and mesh generation procedures using X-ray angiogram. A) AP images of PA and B) lateral PA bi-plane angiogram showing centerlines overlapped on the AP image and diameter superimposed on the later image. C) the skeleton image of the PA, D) after creating surfaces on the skeleton image. E) The fluid domains (in red) and structure domains (in green) are shown, and F) a representative cross section of the MPA mesh [61].
