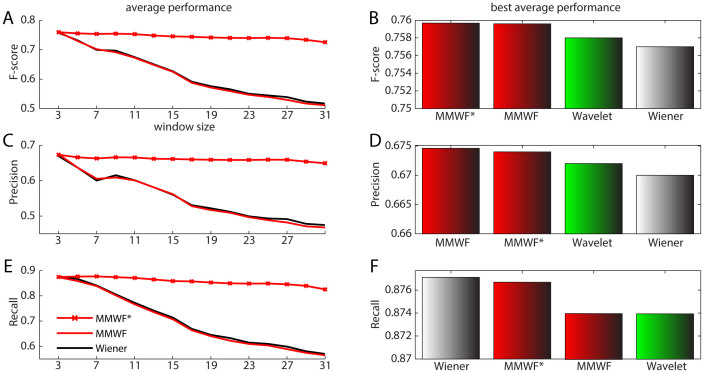
Figure 4. Average performance for 3D spectra.
Subfigures (A), (C), and (E): Average performance curves of the three adaptive spatial filters over the 3D spectra with respect to the window size. (A). average F-score curves; (C). average precision curves; and (E). average recall curves. Subfigures (B), (D), and (F): Bar charts of average performance of the wavelet denoising in Liu et al26 and the three adaptive spatial filters with the best window size on the 3D spectra. (B). average F-score bar charts; (D). average precision bar charts; and (F). average recall bar charts.

