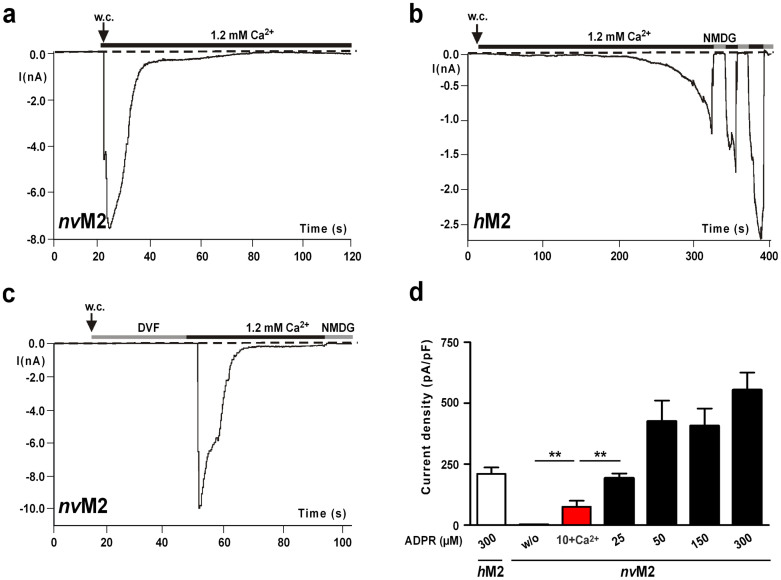
Figure 1. ADPR-dependent currents of nvTRPM2 and hTRPM2.
(a)–(c) Whole-cell patch-clamp measurements in HEK-293 cells. The pipette solution contained 50 μM ADPR (nvTRPM2) or 300 μM ADPR (hTRPM2). Intracellular Ca2+ concentration was adjusted to ≤10 nM. (a) Instantaneous current development of nvTRPM2 after reaching whole-cell configuration (w. c.) in the presence of 1.2 mM extracellular Ca2+. The currents spontaneously and rapidly decline to baseline. (b) Typical slow onset of currents of hTRPM2 recorded under the same experimental conditions as in panel a. Repeated current inhibition by substitution of external Na+ with the impermeable cation NMDG. (c) Same as in panel a, but the whole-cell configuration was established in extracellular divalent-free solution (DVF) in which Ca2+ was buffered with EGTA to ≤10 nM. Currents only developed after the extracellular DVF solution was substituted with standard bath solution containing 1.2 mM Ca2+. (D) Current densities in nvTRPM2 in dependence on the intracellular ADPR concentration. For experiments with 10 μM ADPR (highlighted in red), the intracellular Ca2+-concentration was adjusted to 1 μM, otherwise the intracellular Ca2+-concentration was below 10 nM. For comparison, corresponding data of hTRPM2 at 300 μM ADPR and unstimulated nvTRPM2 (w/o) are shown left. **Indicates a significant difference (P = 0.01) from Student's t-test. n = 8–16. Error bars are s.e.

