
Figure 2.
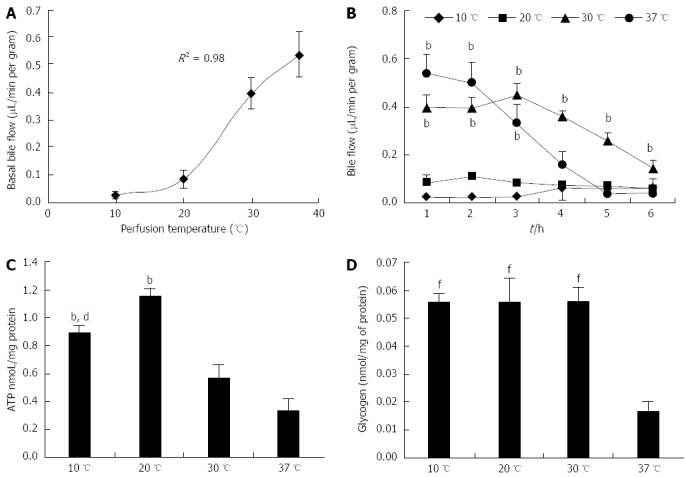
Bile flow, ATP and glycogen levels in rat livers perfused for 6 h. A: Basal bile flow; B: Bile flow during perfusion; C: ATP content; and D: Glycogen content in livers perfused for 6 h at 10, 20, 30 or 37 °C (n = 6/group; B: bP < 0.01 vs 10 and 20 °C; C: bP < 0.01 vs 30 and 37 °C, dP < 0.01 vs 20 °C; D: fP < 0.01 vs 37 °C).