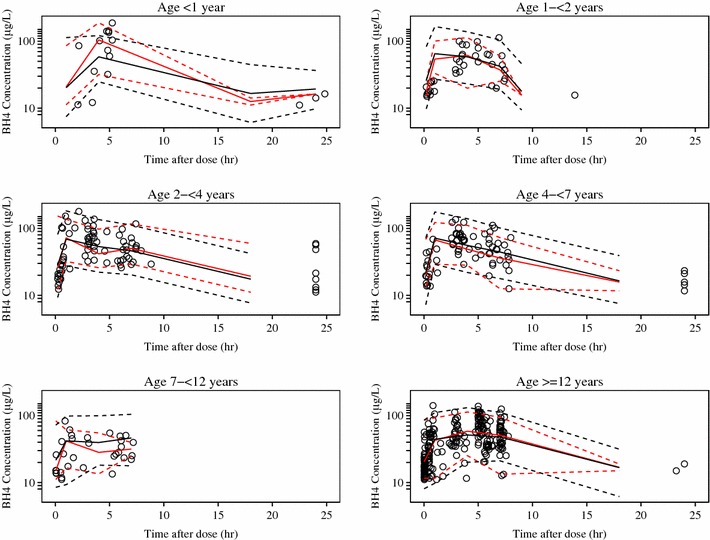
Fig. 1.

Visual predictive check by age group. Open blue circles are observed data, the solid red line is the median observed concentration, dashed red lines are the upper and lower 95 % observed intervals, the solid black line is the median of the simulated data, and dashed black lines are the upper and lower 95th percentiles of the simulated data. BH4 tetrahydrobiopterin
