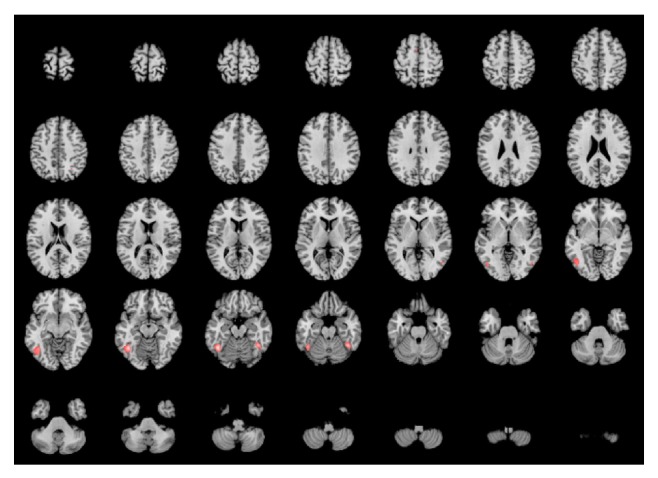
Figure 3.

Conjunction analysis of BA37—language and visuospatial networks. Brain anatomical template and orientation are the same as priorly described. Intensities correspond to ALE scores. Color coding range from red (ALE score 0.01) to white (ALE max = 0.039). Main activations are mostly located in the fusiform gyri and adjacent lateral areas of the left side. A small cluster is observed in the left SMA (inset 5 in first row). This cluster however did not pass the volume threshold (vol = 48 cubic mm).
