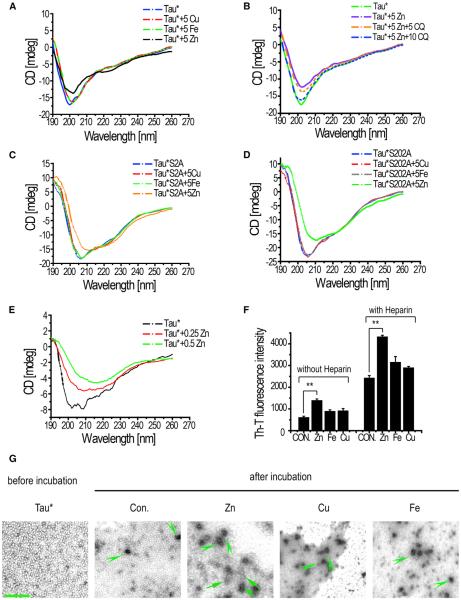
Figure 3. Zinc Interacts with Tau and Induces Tau Conformation Change and Aggregation In Vitro.
(A) Circular dichroism (CD) spectra of Tau* proteins coincubated with different metals. 5 μM copper (Cu), 5 μM iron (Fe), and 5 μM zinc (Zn) were used. Protein concentration: 70 μg/ml.
(B) CD spectra of Tau* proteins incubated with Zn and CQ. 5 μM Zn was used to induce conformation change, and 5 or 10 mM CQ was used to reverse the zinc effects. Protein concentration: 70 μg/ml.
(C and D) CD spectra of Tau*S202A and Tau*S2A incubated with different metals at the “low concentration” (5 μM). Protein concentration: Tau*S2A: 70 μg/ml; Tau*S202A: 90 mg/ml.
(E) CD spectra of Tau* proteins under even lower Zn concentrations. Note lower concentrations of Tau* protein (40 μg/ml) and zinc (0.25 μM) were used. The reaction systems were dialyzed to remove zinc and concentrated by polyoxyethylene before measuring their CD spectra.
(F) Th-T fluorescence was used to detect Tau polymerization. Tau* proteins were incubated with 5 μM Zn, 5 μM Cu, and 5 μM Fe, respectively, in the presence or absence of 1 μmol/ml heparin as a polymerization inducer. Shown here are fluorescence signal changes after 7 days of incubation. Data represent mean ± SEM. **p < 0.01.
(G) TEM images of Tau* proteins coincubated with different metals. Arrowheads indicate possible Tau oligomers, and big arrows indicate small filaments formed by Tau aggregations. Protein concentration: Tau*: 70 μg/ml. The scale bar represents 200 nm.

