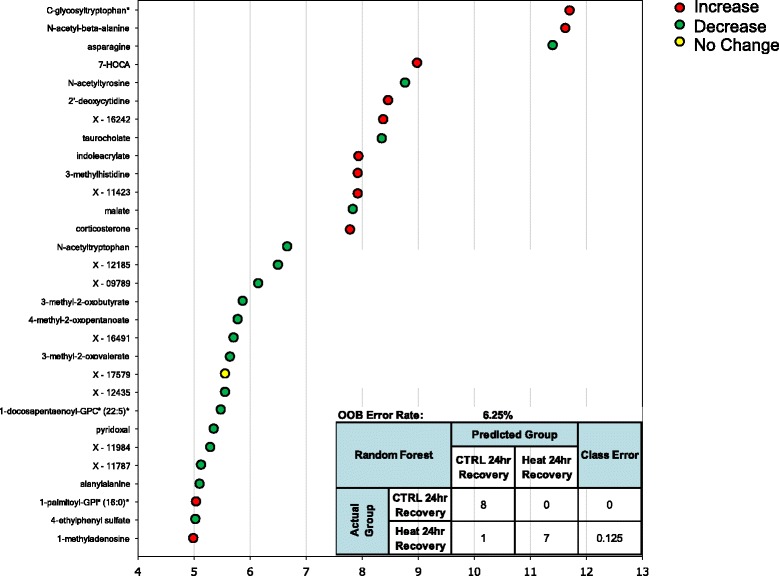
Figure 7.

Random forest analysis accurately discriminates heat exposure from unheated controls at 24 hours. The top 30 metabolites were identified in OOB selection to have 94% predictive power by random forest analysis at Tc,Max. The inset represents predictive power of the 30 biochemicals identified. Colored circles indicate biochemicals that were also significantly up (red) or down (green) regulated, p < 0.05, 2-way ANOVA with contrasts. One biochemical was not significantly altered by ANOVA analysis (yellow). Biochemicals marked by an asterisk indicate likely identifications based on MS/MS fragmentation and other chemical properties.
