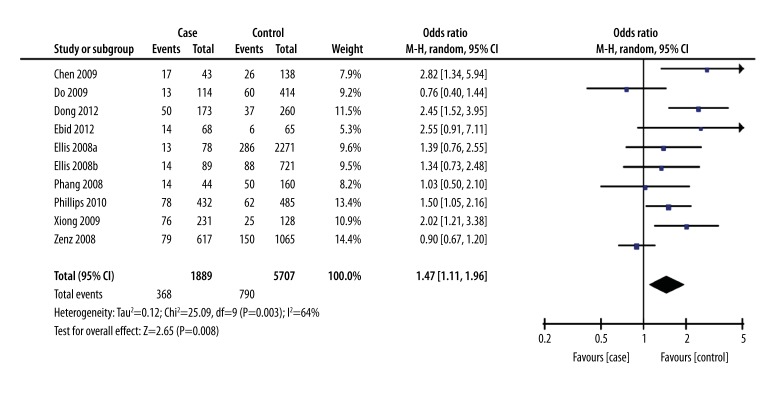
Figure 1.
Forest plot of leukemia susceptibility and SNP309 of MDM2 gene (a recessive model: GG vs. GT+TT), the horizontal lines correspond to the study-specific OR and 95% CI, respectively. The area of the squares reflects the study-specific weight. The diamond represents the pooled results of OR and 95%CI.

