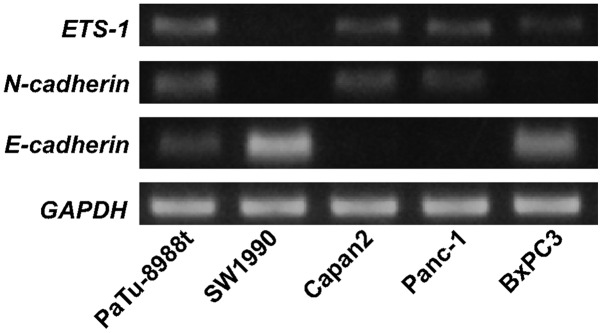
Figure 1.

Analysis of mRNA expression levels of ETS-1, N-cadherin and E-cadherin in five pancreatic cancer cell lines. RNA levels of N-cadherin, E-cadherin and ETS-1 were determined by RT-PCR in five pancreatic cancer cell lines. GAPDH was included as a normalization control. ETS-1, v-ets erythroblastosis virus E26 oncogene homolog 1; GAPDH, glyceraldehyde-3-phosphate dehydrogenase.
