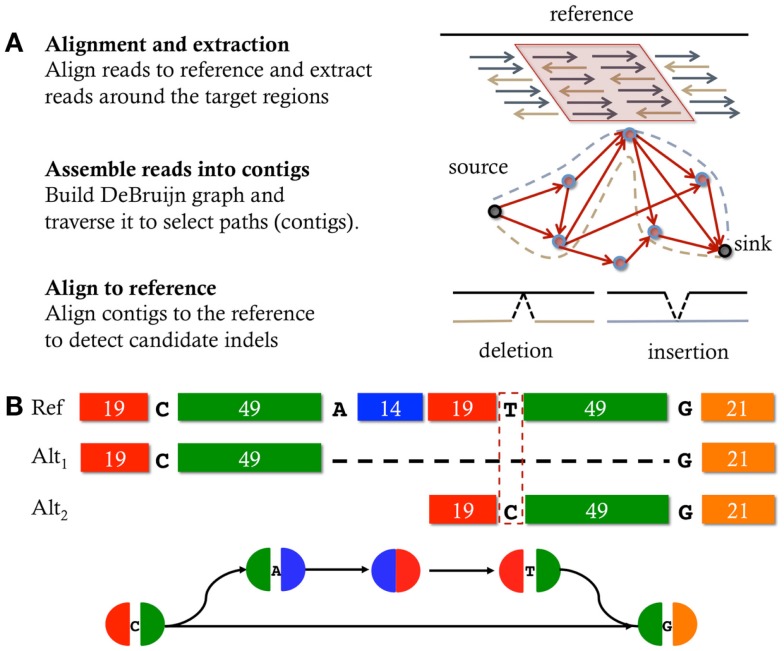
Figure 1.
Micro-assembly. (A) typical workflow of the micro-assembly strategy: given a specific region of interest, the reads, previously aligned to the reference, are extracted, assembled, and then contigs are aligned back to the reference to discover mutations. (B) Schematic representation of a bubble in a De Bruijn graph induced by a heterozygous mutation within a repetitive sequence composed of two near-identical copies (with 1 bp mismatch) that are 15 bp apart. Each block represents a sequence; sequences that have the same base pair composition have the same color; the length of each sequence (in base pairs) is reported inside each block. Each node of the graph is colored according to the order and sequence composition contained in it. Simple (non-branching) paths are represented in a single node. Alt1 and Alt2 are two alternative alignments of the sequence contained in the bottom side of the bubble, where the dashed line represents the alignment gap. The top side of the bubble matches the reference. Any k-mer longer than the longest identical repeat (>49 bp) and shorter than the longest near-identical repeat (<69 bp) would create a bubble like the one depicted (B) where a jump is allowed from the first copy of the near-identical repeat to the second copy.

