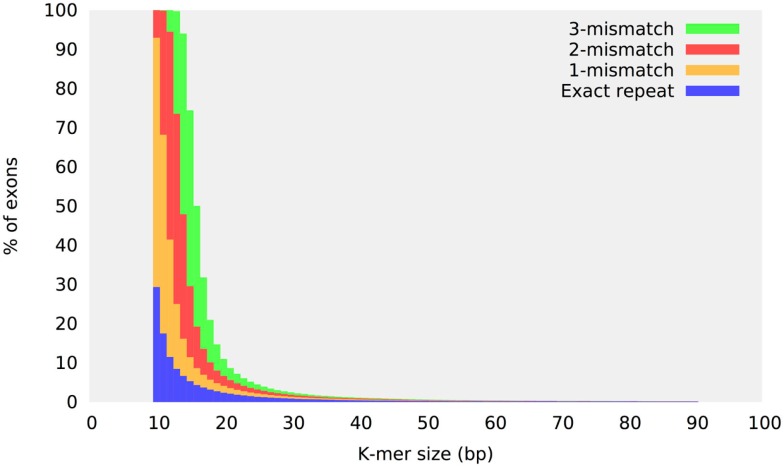
Figure 2.
Repeat content in the human exome. Repeat content distribution in the human exome target regions as a function of the k-mer size. The sequence of each target exon is analyzed to check for the presence of a repeat structure within the same region defining the exon. The y-axis reports the percentage of those exons that have been found to contain an identical or near-identical repeat of size k (up to three mismatches).

