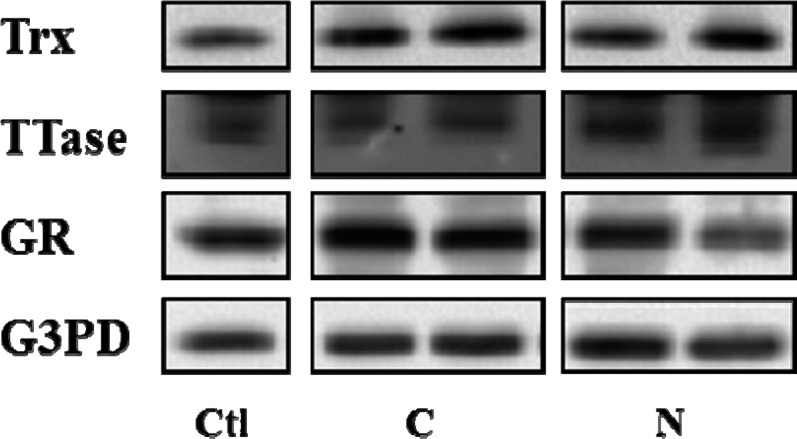
Figure 5.
Comparison of protein levels of TTase, Trx, GR, and G3PD in the cortex of cortical and nuclear cataracts. Equal amount of proteins from the cortical portion was used for Western blot analysis for the protein levels of Trx, TTase, GR, and G3PD, with respective specific antibodies. C, cortical cataract; N, nuclear cataract; Ctl, control.

